General introduction
Chemoton
The research group of Markus Reiher at ETH Zürich has developed the software enviroment SCINE which pursues the performance of quantum chemical calculations with special focus on algorithmic stability, automation, interactivity, efficiency and error control. In this context, Chemoton is the SCINE module in charge of constructing CRNs in a fully automated fashion based on first-principles.
The reaction network results from Chemoton can be visualized with the graphical user interface developed in the same SCINE framework, named Heron. This GUI has many functionalities beyond visualization, such as monitoring and steering the exploration, as well as creating json files to make the whole process reproducible.
> Here we offer a complementary visualization tool aimed at providing an interactive visualization of the CRN without any previous dependencies. We highlight, however, that VizChemoton is just meant for creating a light-weight and convenient visualization format of the CRN, thus making it easily accessible to the scientific community.
amk-tools
The research group of Carles Bo at ICIQ (Tarragona, Spain) developed a library, named amk-tools allowing the reading, processing and visualizing the reaction networks constructed by AutoMeKin, an automated reaction discovery program developed by Emilio Martinez Nuñez (Galicia, Spain).
> Here we tailor the application of amk-tools to the visualization of CRNs constructed with Chemoton.
VizChemoton
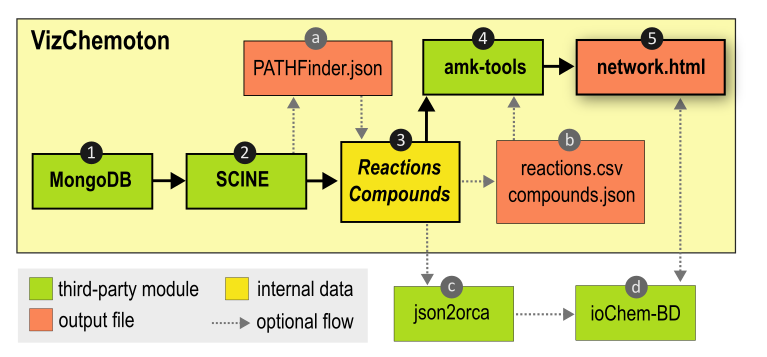
In the following diagram we describe the modules that VizChemoton uses to generate the .html file. The full workflow starts from querying the MongoDB (1) using the SCINE modules (2) to obtain the reactions and compounds of the reaction network. Because querying the MongoDB might be a time-consuming step, we have enabled the option to export the network as a .json file, so that for future runs, the network can be directly imported (a). The reaction and compounds data are also stored in a .csv and .json files respectively (b). This allows importing the reaction and compound data without querying MongoDB nor the SCINE dependencies. To generate the visualization of the network, the amk-tools is called (4) which ultimately writes the .html file (5).
Notice that the chemical data present in the network.html can also be converted into pairs of input-ouput files using json2orca (c) so that the data can be uploaded in the FAIR repository ioChem-BD (d).